1. Introduction
Historically, commercial aircraft production is the paragon of an industry that has been characterized by the intimate linkage of economics and politics and of private and public interests ever since its birth between the world wars.1 Like, for example, the synthetic rubber, semiconductor or computer industries, the post-1945 commercial aircraft industry arose from the military application and, thus, government-backed development of the relevant key technologies.2 Knowledge spillovers from military production and government subsidies helped producers overcome high investment thresholds, and governments’ demand guarantees reduced uncertainty about investments’ amortization in the future.3 This link was strongest in the United States, where the Buy American Act of 1933 required the US government to prefer US made products in its purchases, enabling the leading American military aircraft producers Boeing, (McDonnell) Douglas, and Lockheed to finally establish dominance over the market for (large) commercial jet aircraft by the early 1970s, too (Fig. 1).4
Fig. 1. Manufacturers’ market shares in the market for commercial jet aircraft, 1958-1973
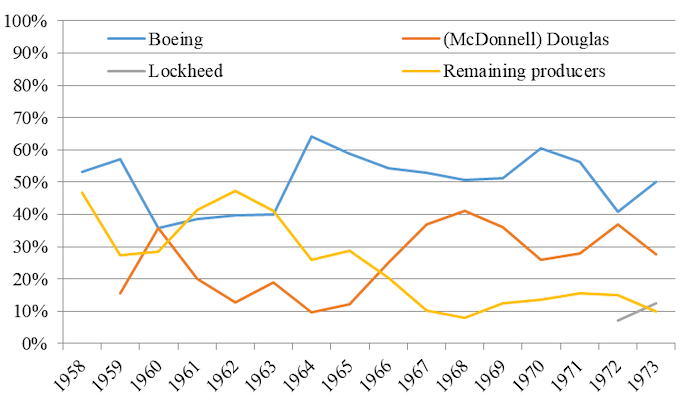
Market share is manufacturers’ deliveries divided by total deliveries. Wide-body jets included since 1969.
(R. Baldwin, P. Krugman, “Industrial Policy and International Competition in Wide-bodied Jet Aircraft”, in R. E. Baldwin (ed.), Trade Policy Issues and Empirical Analysis (Chicago: Chicago University Press, 1988), 45-78, here 48-49)
But besides leveraging a national aircraft industry whenever possible, governments all over the world also showed their strong stake in the upstream activity by regulating the airline industry in almost every aspect.5 Until the 1980s, for example, almost every national flag carrier outside North America was still firmly in the hands of the state; and almost all airlines’ scheduled international flights were managed by a tolerated cartel, the International Air Transport Association (IATA).6 In the single-biggest market, the United States, regional monopolies regulated domestic air traffic business until the deregulation of the industry under the Carter-Administration in the late 1970s.7
Fig. 2. The market for wide-body jets, 1969-1989
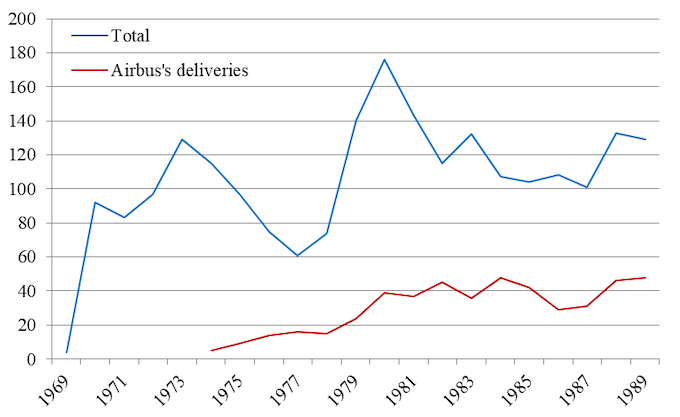
“Total” is the sum of all deliveries of Airbus A300/A310, Boeing B747/B767, Lockheed L-1011, and McDonnell Douglas DC-10 jets.
(Authors’ dataset, see below)
Fig. 3. Manufacturers’ market shares in the wide-body segment, 1969-1989
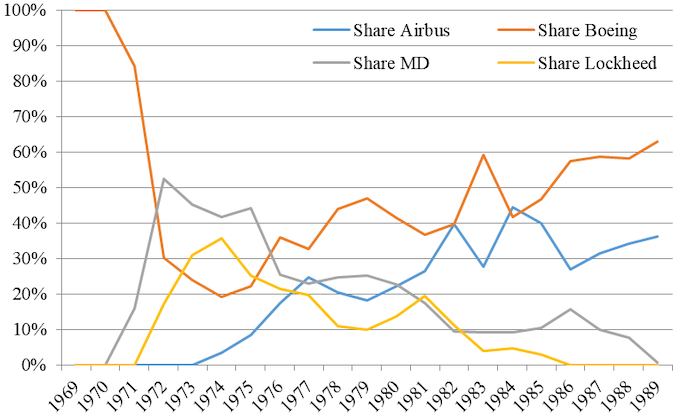
Based on deliveries per manufacturer.
(Authors’ dataset, see below)
Seen against this background, the Airbus Consortium founded in 1970 certainly is a child of its time as it was carried by aerospace companies that were owned by the governments of France, Germany, Spain (since 1971), and Great Britain (since 1979). As one of the two leading members, France had wanted to put a stop to the increasing dominance of US aircraft manufacturers with her Caravelle, Concorde, Mercure, and now Airbus projects; and, as a junior partner, Germany had seen its opportunity to revive its long-standing aircraft industry and return to the market for civil aircraft. Initially, US manufacturers were giving the Airbus project just as little a chance to survive as they had given the Concorde and the Mercure.8 However, Airbus’s first major sales successes with its wide-body introduced in 1974, the A300, emerged at the end of the 1970s. A decade later, and after two oil price crises, Airbus had grown into a serious competitor for Boeing, holding a market share of roughly 38 per cent, while McDonnell Douglas had shrunken to a marginal player and Lockheed had exited the market for good (see figures 2 and 3).
Accusations of unsound practices were raised more outspokenly at the latest when Airbus could win Eastern Airlines as a customer in late 1977;9 Eastern Airlines received its first A300 on a leasing basis (“fly before you buy”) and would become the A300’s top first-hand customer of the 1970s and 1980s, with 32 deliveries overall.10 For one, the Americans, and especially market leader Boeing, pointed to the large loans on favourable conditions and other, more direct subsidies that the Airbus consortium received from its member states’ governments; had Airbus not been subsidized from the start, it would not just have stayed a small player, but a reasonable management would not even have taken the decision to enter the market at all.11 Beyond that, Europeans were accused of exerting direct political influence on the sale of their new aircraft, too, and they reacted with counter-reproaches referring to the cross-subsidization of US civil aircraft production by military orders. Recall that the B747 partially emerged from a lost bidding on a military heavy transport aircraft; it was Lockheed that won the bid with its C-5 Galaxy.12 Years of litigation within the framework of the GATT and the World Trade Organization (WTO) followed suit.13
The factors having enabled Airbus’s rise have been intensely debated not only among practitioners and politicians, but also in the academic literature. Basically, there are two strands of argumentation. On the one hand, it is emphasized that the A300 and the A310 were technologically superior to American aircraft and designed to fill a market niche not yet served, namely, the niche of a relatively more fuel-efficient twin-engine, short- to medium- range wide-body. Irrespective of the issue of government support, airlines bought Airbus aircraft primarily for reasons of economic efficiency.14 Principally related to this argument is the view that Airbus’s long-term rise not only owes to constant technological but also organizational innovation.15
Fig. 4. Airbus A300 and A310
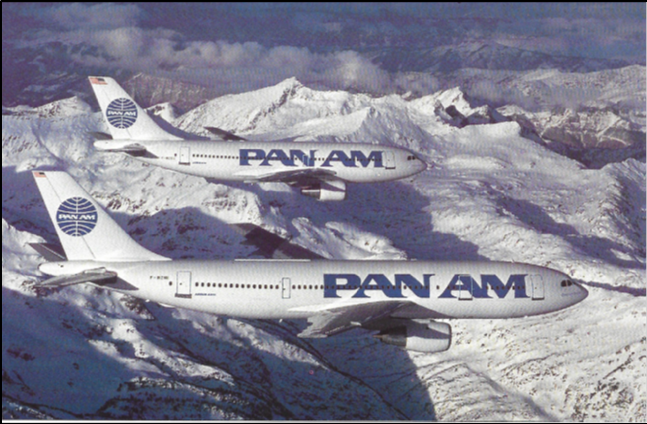
Pan Am’s order of 30 Airbus A300 and A310 aircraft were part of Airbus’ final breakthrough on the US market in the early 1980s (561 and 255 delivered between 1974 and 2007)
(Pan American World Airways)
Other authors stress that it is indeed necessary to focus on the issue of government support to understand Airbus’s success. It should be made a clear distinction between the “market” and the “nonmarket” environment within which commercial aircraft production has been taking place. Airbus’ success owes at least as much to nonmarket strategies, or factors, as it does to market-related ones.16 Following Sandholtz and Love (2001), nonmarket strategies:
[…] include subcontracting and, […], coproduction offers; investment in local training or maintenance facilities; strategic manipulation of forecasts; diplomatic pressure applied by institutions such as the European Commission (EC), European leaders and trade representatives; and lobbying and even bribery of airline officials.17
With a direct reference to Airbus, Sandholtz and Love conclude that:
[s]ince Airbus competes in a highly visible, important trade sector and is a consortium composed of nationally owned aerospace companies, it should be no surprise that diplomatic pressure, often at the highest levels, is utilized to improve Airbus’ fortunes. For example, the French government has often linked inducements such as landing rights, technical assistance, and special trade agreements to the purchase of Airbus transports. Indeed, even in the early years of Airbus, Boeing executives and U.S. government officials repeatedly complained about Airbus’s “government-to-government-type selling effort”.18
However, it has not yet been examined in breadth – that is, taking all sales deals into account – to what extent political pressure as described more theoretically in the former quote and more practically in the latter has been used to market Airbus aircraft and how many jets have factually been sold or, respectively, purchased as a direct result. Interestingly, these questions have not been raised regarding American manufacturers, even though there is no reason to think – at least, not that we can see – that making decent use of nonmarket strategies has been the sole domain of Airbus.19
The mutual accusations of political influence on sales are the subject of an economic-historical project that we have started on the first twenty years of the market for wide-body jets. With this article, we want to lay the project’s foundation – that is, elaborate on the project’s idea, on our database, and on some preliminary descriptive evidence which further inquiries can link up with. We are interested in the extent to which the accusations were justified and, if so, to which manufacturers and periods this applies. Principally, this agenda requires examining and classifying each and every sale or, respectively, order placed between 1969 and 1989 according to some notion of what a “political sale” is; and, ideally, we gathered the necessary information by drawing on material from all manufacturers’, all customers’, and all involved governments’ archives to this end. However, the prospective effort would be tremendous, and given the high incidence of proven and suspected corruption in the aircraft business,20 we do not reckon with getting the necessary access to the documents we needed. Therefore, we rely on an indirect empirical approach based on mass data on all wide-body jet deliveries between 1969 and 1989 in the first place.21 Thus, more specifically, we seek insights into how far Airbus’s and Boeing’s sales might have been political from a bird’s eye perspective which provides us, at least, with suggestive evidence on the matter. Because Airbus started with two wide-body jets, the A300 and the A310,22 our primary focus is on this market segment (also Table A.1). Our statistical mass-data setting requires measuring aspects of aircraft sales’ (potential) political nature by gathering or constructing suitable variables. In Section Two, we will outline our notion of a “political sale” in a more narrow sense of the word and introduce a set of such variables thereupon. We then go on to present our datasets in Section Three – a baseline dataset on the aircraft-level, assembling information on all wide-body jets delivered between 1969 and 1989, and a dataset on the airline – or, more precisely, first-hand customer-level. In Section Four, we discuss first, preliminary evidence based on a descriptive analysis of our datasets.
2. How to imagine a “political sale”
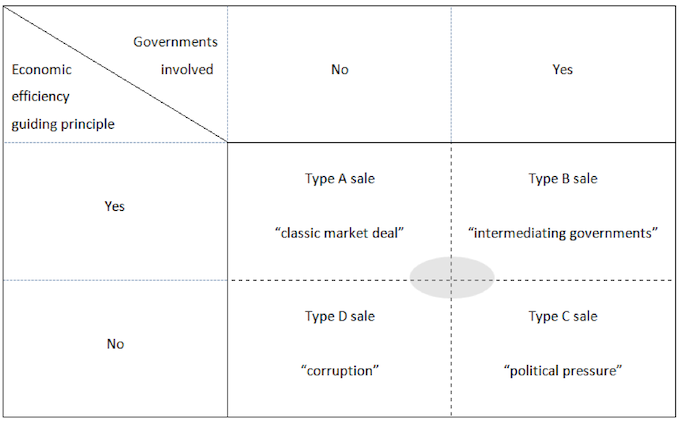
Combining the two views on Airbus’s rise outlined above (cf. paragraphs five to eight), we may distinguish sales deals along two lines, namely, whether or not a deal materializes because economic efficiency considerations guided the buyer’s choice in the first place (buyer’s motivation); and whether or not it is government involvement facilitating the closing of the deal between seller and buyer (government intervention). Fig. 5 is an attempt at establishing a simple (ex-post) classification of sales deals along these two lines.
We define a sales deal to be “political” if, and only if, intervention of the governments standing behind seller and buyer is involved in the closing of a specific deal. This intervention may take two forms: On the one hand, it may take a moderate form in which a government promotes a domestic seller’s success on the world market by granting case-specific direct or indirect subsidies (non-repayable grants, favourable credit terms, export finance) and/or by intermediating on the seller’s behalf through its relations to the potential customer’s home government.23 We imagine involved governments, so to say, furnished their diplomatic channels to ease communication between both parties and may serve as (financial or legal) guarantors of the deal while economic efficiency considerations on the buyer’s side prevail (Type B).24
On the other hand, the less moderate form of government intervention is given if the seller’s government exerts pressure on the buyer’s government which passes the pressure right on to the buyer itself. The seller’s government might use diplomatic or financial leverage merely to support its domestic business or because it has a stake of its own in the game. Alternatively (or in addition), the pressure on the buyer might (partly) lead right back to genuine interests of its own government. The involvement of political pressure is equal to the buyer’s motive of ensuring economic efficiency to have factually faded into the background (Type C).
Fig. 5. Political versus non-political sales
(Authors’ own depiction)
In contrast, sales of type A and D are closed without government intervention but could nonetheless involve other nonmarket strategies, with bribery probably being the most extreme strategy of all nonmarket-non-government-reliant strategies. All four types of sales, of course, reflect ideal types. In reality, there might well be a sales deal involving intermediating-only governments, but also a nonmarket strategy modifying the buyer’s motivation to buy, like bribing certain decision-makers. The grey-shaded area in Figure 5 is supposed to indicate that there might be some overlap.
Principally, there is another, latent motive to buy, namely, taste.25 In its broadest sense, taste may, for example, include the phenomenon that countries, or for that matter: firms, have deeper trade relations with geographically or culturally close partners. In the same vein, one country may feel more sympathetic with another country because there is a match in political attitudes or agendas, which makes it more likely that these two countries establish trade relations. A nice example is the travel of French President Valéry Giscard d’Estaing through the Middle East in March 1980 during which he promoted, among others, Palestinians’ right for self-determination. Middle Eastern states basically caught this to be an anti-Israeli sentiment. In the following, several Middle Eastern airlines (e.g. Kuwait Airways and Saudia) turned to Airbus and placed highly welcomed orders.26 While these sales certainly were political, they were so in a very broad sense best put under the header of “(political) taste”. However, our definition is narrower.
To measure certain aspects of the political nature of aircraft sales, we consider five variables. Firstly, we consider an airline’s ownership status (fully state-owned vs. mixed public-private ownership vs. fully privately-owned). We imagine full state-ownership of potential customer airlines to have been important in arranging a political sale. Although not a necessary precondition for a sale to be political, we suppose that full state-ownership of an airline is a vital catalyst that significantly raises the likelihood of a type C sale to happen, because it helps political pressure find its way into the buyer’s management and therefore facilitates decision-making process.27 Secondly, we consider the polity of an airline’s home country – that is, whether it was a more democratic or a more autocratic state. The idea behind is that, irrespective of an airline’s ownership status, an autocratic government can much easier intervene into an airline’s management if pressured by a stronger state. Thirdly, we consider the historical colonial ties of an airline’s home country with France, Great Britain, and the United States. The economic, economic-historical, and political science literatures have assembled evidence that past colonial relations do matter long after a colony gains its independence and that a mother country may well maintain diplomatic and financial control to a degree and, thus, has leverage to pursue its interests.28 Fourthly, we consider international trade relations of an airline’s home country with the Airbus consortium member countries as well as with the US. Trade structure serves as a measure of “trading partner taste” as outlined above and bilateral trade position (net surplus or deficit) as a possible trigger for trade tensions and governments’ countermeasures.29 Finally, fifthly, we consider development aid flows from the Airbus consortium member countries as well as from the US to an airline’s home country. Like financial flows from the former colonial master to its former colony, development aid flows provide leverage, but may also trigger a feeling of being obligated to the aiding country.30
The basic idea of our approach is to check whether these variables are significant determinants of airlines’ decision to acquire Airbus or Boeing aircraft. For example, if it turned out that airlines from former French colonies were significantly more likely to have bought Airbus aircraft instead of American jets in the 1970s and 1980s, this would be at least suggestive, indirect evidence that colonial ties – and the leverage included in them – mattered. Thus, looking more closely at all sales deals involving airlines from former French colonies would be a promising road and a natural follow-up endeavour.
Prinicipally, our main hypotheses are as follows:
H1.1: Airbus (Boeing) sold significantly more (less) likely to state-owned airlines than to privately-owned ones;
H2.1: Airbus (Boeing) sold significantly more (less) likely to airlines from countries exhibiting a low level of polity (on the Polity V project’s scale; see below) than to countries exhibiting a high level of polity;
H3.1: Airlines from former French and British (US) colonies significantly more likely bought Airbus (Boeing) aircraft;
H4.1: The larger the weight of the Airbus consortium member countries (the US) as trading partner(s) of a country, the more likely did an airline of that country buy Airbus (Boeing) aircraft;
H5.1: The larger the development aid flows from the Airbus consortium member countries (the US) to a receiving country, the more likely did an airline of that country buy Airbus (Boeing) aircraft.
In the empirical section below, we will provide first, suggestive evidence on these hypotheses using purely descriptive methods.
3. Data
To pursue our statistical approach, we created two datasets. The first dataset assembles information on each wide-body aircraft delivered (not ordered!) between 1969, when the B747 as the first wide-body entered the scene, and 1989.31 We recorded 2,21532 deliveries of wide-body jets to 145 different first-hand customers, namely, 131 passenger airlines (including mixed passenger-cargo airlines), five pure cargo airlines, and nine miscellaneous customers.33 In case of a merger, we counted the merged airlines and the newly created airline separately.34 By definition, a first-hand customer is a first passenger airline, cargo airline, or miscellaneous customer to have received a newly-manufactured aircraft (as opposed to a second-hand aircraft). Importantly, 55 deliveries posed a challenge regarding the clarification of the first-hand customer because aircraft were concerned that were not taken up by the originally ordering airline, possibly for reasons of illiquidity, insolvency, or merger. While we do know the originally ordering airlines, we decided to select as first-hand customer the effective first user. For example, the A300 with the manufacturer serial number “9” was originally ordered by Air Siam, which ceased operations in 1976, and effectively delivered to Air France in July of the same year.
Table 1 shows the composition of the baseline dataset by manufacturer, aircraft type, and airline. While the Airbus, Boeing, and McDonnell Douglas models have been produced beyond 1989, the Lockheed Tristar was exclusively delivered in the 1970s and the first half of the 1980s. As is evident from Table 2, the ten most frequent first-hand wide-body customers up until 1989 account for no less than 845 deliveries, equalling a share of 38.1 per cent in total deliveries (cf. also Table A.2).
Table 1. Baseline wide-body aircraft dataset, 1969-1989
|
Manufacturer/Aircraft type |
Observed over |
No. of deliveries |
No. of first-hand customers per manufacturer/aircraft typea |
||
|
Airbus |
1974-1989 |
484 |
67 |
||
|
A300 |
1974-1989 |
321 |
47 |
||
|
A310 |
1983-1989 |
163 |
30 |
||
|
Boeing |
1969-1989 |
1,036 |
91 |
||
|
B747 |
1969-1969 |
755 |
74 |
||
|
B767 |
1982-1989 |
281 |
35 |
||
|
Lockheed L-1011 (Tristar) |
1972-1985 |
249 |
20 |
||
|
McDonnell Douglas DC-10 |
1971-1989 |
446 |
52 |
||
|
Total |
1969-1989 |
2,215 |
145a |
||
a The sum total does not equal the sum over the sub-entities due to double-counts.
(Authors’ dataset)
Table 2. The ten biggest first-hand customers according to deliveries received, 1969-1989
|
Airline |
Country |
A300 |
A310 |
B747 |
B767 |
DC-10 |
L-1011 |
Total |
|
American Airlines |
USA |
25 |
– |
16 |
45 |
35 |
– |
121 |
|
Japan Airlines |
Japan |
– |
– |
65 |
15 |
22 |
– |
102 |
|
Pan Am |
USA |
12 |
16 |
45 |
– |
1 |
– |
86 |
|
United Airlines |
USA |
– |
– |
23 |
19 |
42 |
12 |
84 |
|
Delta Airlines |
USA |
– |
– |
5 |
30 |
5 |
43 |
83 |
|
All Nippon Airways |
Japan |
– |
– |
20 |
39 |
– |
21 |
80 |
|
Lufthansa |
Germany |
18 |
14 |
35 |
– |
11 |
– |
78 |
|
Eastern Airlines |
USA |
32 |
– |
– |
– |
– |
40 |
72 |
|
Trans World Airlines |
USA |
– |
– |
23 |
10 |
– |
38 |
71 |
|
Air France |
France |
24 |
9 |
36 |
– |
– |
– |
69 |
(Authors’ dataset)
Table 3 illustrates the structure of our aircraft-level dataset currently consisting of 34 variables per aircraft. Columns (1) to (11) refer to the particular aircraft; columns (12) to (21) to the first-hand customer by which it was acquired; and columns (22) to (34) to customer’ home country. All entries refer to the point in time when the aircraft was delivered. The majority of entries are binary coded, with the value 1 indicating that the measured characteristic can be observed in the aircraft; cf. Table A3 in the Appendix for a complete list of all 145 airlines.
Table 3. Structure of the aircraft-level dataset, 1969-1989
|
(1) |
(2)c |
(3)c |
(4)c |
(5)c |
(6)c |
(7)c |
(8)c |
|
ID |
Manufacturer |
MSN |
Model |
Version |
First registration |
Delivery (dd/mm/yyyy) |
First customer |
|
1 |
Airbus |
2 |
A300 |
B1 |
OO-TEF |
25/11/1974 |
Trans European Airways |
|
… |
… |
… |
… |
… |
… |
… |
… |
|
2,215 |
Boeing |
24,406 |
B747 |
400 |
VH-OJC |
09/10/1989 |
Qantas |
|
(9)c |
(10)c |
(11)c |
(12)c |
(13) |
(14)c |
(15)c |
(16)c |
|
Passenger aircraft |
Cargo Aaircraft |
Miscellaneous aircraft |
Country of origin |
Customer ID |
Passenger airline |
Cargo airline |
Miscellaneous airline |
|
1 |
0 |
0 |
Belgium |
116 |
1 |
0 |
0 |
|
… |
… |
… |
… |
… |
… |
… |
… |
|
1 |
0 |
0 |
Australia |
100 |
1 |
0 |
0 |
|
(17) |
(18)a d |
(19)a d |
(20)a d |
(21)a d |
(22) |
(23) |
(24) |
(25) |
|
Customer founding datea |
Public ownership |
Private ownership |
Mixed ownership |
Unstable ownership |
Airbus Consortium member |
Euro-pean |
Central/ South America |
North America |
|
1970 |
0 |
1 |
0 |
0 |
0 |
1 |
0 |
0 |
|
… |
… |
… |
… |
… |
… |
… |
… |
… |
|
1920 |
1 |
0 |
0 |
0 |
0 |
0 |
0 |
0 |
|
(26) |
(27) |
(28) |
(29) |
(30) |
(31) |
(32)b |
(33)b |
(34)b |
|
African |
Middle Eastern |
Southern Asian |
South-Eastern Asian |
Eastern Asian |
Oceanic |
Colonial history with France |
Colonial history with Great Britain |
Colonial history with USA |
|
0 |
0 |
0 |
0 |
0 |
0 |
0 |
0 |
0 |
|
… |
… |
… |
… |
… |
… |
… |
… |
… |
|
0 |
0 |
0 |
0 |
0 |
1 |
0 |
1 |
0 |
MSN is “manufacturer serial number”.
a For all but four airlines, ownership status remained constant throughout the observation period; Air Canada, British Airways, and Japan Airlines switched from state (via mixed) to private ownership in the 1980s, and Philippine Airlines switched from private to mixed ownership in 1976 (captured by variable 21).
b We focused on the last colonial master and ties sustaining into the recent past. For the latter fact, we do not consider a country’s former colonial ties to Spain or Germany.
(c Sources are the production lists and airline information as deposited at www.planespotters.net and www.airfleets.net.
d Information extracted from the airline histories as deposited in Wikipedia.)
Based on this aircraft-level dataset, we built a cross-sectional dataset on the customer- or, as will be our shorthand from now on, airline-level to which we added further variables. This dataset’s structure is shown in Table 4. Columns (1) to (26) refer to the airline and columns (27) to (48) to the airline’s home country. This dataset enables us to investigate the political determinants of airlines’ choice to buy, or not to buy, Airbus and Boeing aircraft. Corresponding to the aircraft-level dataset, the majority of entries are binary coded, with the value 1 indicating that the measured characteristic can be observed in the airline.
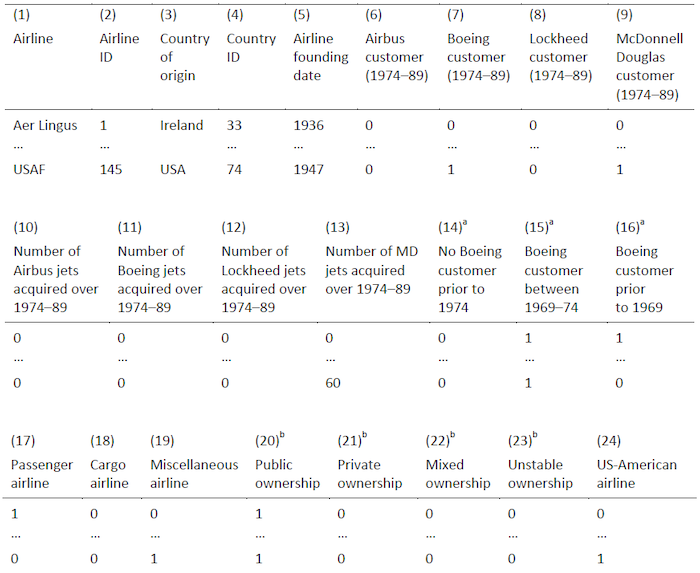
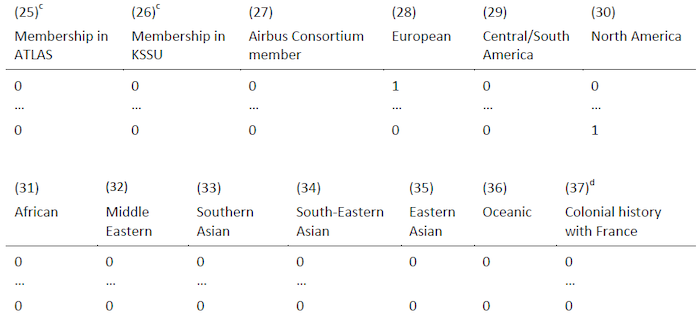
Table 4. Structure of the airline-level dataset, 1974-1989
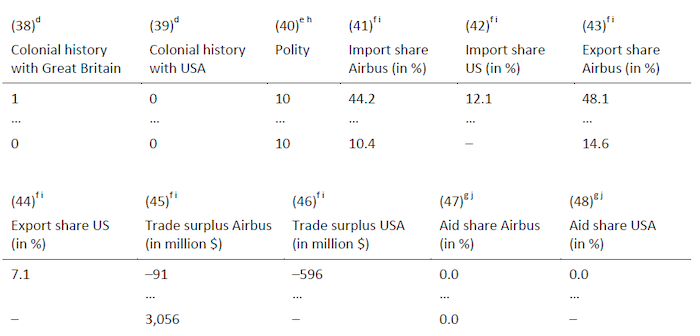
“Airline” is shorthand for all types of first-hand customer.
a Variables 14 to 16 capture whether an airline has already middle- and long-term relationships with Boeing as of 1974 (“narrow-body relations” included).
b Cf. Table 3.
c ATLAS and KSSU maintenance alliances, see footnote 38.
d Cf. Table 3.
e “Polity” is the home country’s average polity-level over 1969-1989 according to the Center for Systemic Peace’s Polity V Project. The polity-level ranges between -10, denoting a full autocracy, to +10, denoting a full democracy.
f The trade structure variables equal the share of all Airbus member countries and, respectively, the USA in a country’s imports and exports averaged over 1974-1989. The variables are not defined for US-airlines and airlines from Airbus member countries. Trade surplus is the net trade surplus of the respective home country with the Airbus member countries and, respectively, the USA. The variables are not defined for US-airlines and for airlines from Airbus member countries.
g We focused on what the OECD labels “total official development flows (ODF)”. To be precise, we recorded total receipts of ODF for each receiving country in our dataset and ODF granted by the Airbus consortium member states and by the US to calculate the shares. We considered direct aid flows between, for example, France and a receiving country here. Total ODF includes these unilateral flows as well as flows channeled through supranational organizations. Aid share is the joint share of the Airbus consortium member countries and, respectively, the share of the United States in a country’s receipts of total official development aid averaged over 1974-1989. The variables are not defined for US-airlines and for airlines from Airbus member countries.
(h The Polity V Project’s database is available at www.systemicpeace.org/inscrdata.html.
i Main source for international trade data – i.e., bilateral import and export flows – is the Correlates of War Project’s Trade Data Set as described in K. Barbieri, K., O. M. G. Keshk, B. Pollins, “Trading Data: Evaluating our Assumptions and Coding Rules”, Conflict Management and Peace Science, 26 (2009), 471-491; it is available at http://correlatesofwar.org.
j Main source on development aid flows is the OECD; cf. https://stats.oecd.org/Index.aspx?DataSetCode=BTDIXE.)
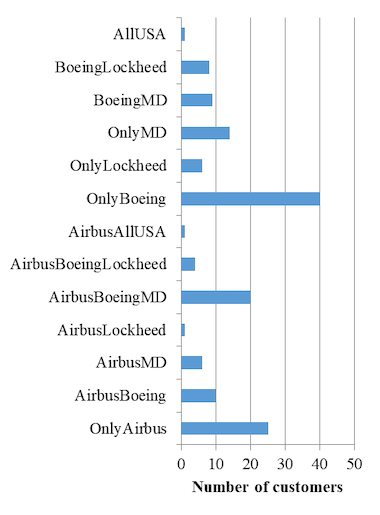
Formally, our airline-level dataset can be deconstructed into several subsamples according to the combination of aircraft models acquired. Figure 7 shows the number of airlines (panel on the right) and the corresponding number of acquired jets (panel on the left) by all thirteen combinations that occur in our dataset. Most notably, out of 145 airlines, 40 airlines exclusively bought Boeing wide-bodies in the observation period, 25 exclusively Airbus jets, 14 exclusively the DC-10, and 6 exclusively the L-1011 Tristar. However, these 85 airlines together merely account for 329 jets, that is, 14.8 per cent of total deliveries. In contrast, 1,886 or 85.2 per cent of delivered wide-bodies fall on less than half of all airlines, namely, 60, and these airlines acquired a mix of models of two or three different manufacturers. Note that the only airlines that acquired wide-bodies of all three American manufacturers were Delta Airlines and Pan Am, with the latter also acquiring Airbus jets. The single-largest category in terms of jets delivered is the group of airlines – among them many of the big players – that acquired a mix of Airbus and Boeing jets coupled with the DC-10 (526 jets), followed by the category of airlines having acquired a mix of Boeing jets and the DC-10 (386). Finally, 78 airlines, thus slightly more than half, exclusively acquired American jets (994 in total).
Fig. 6. McDonnell Douglas DC-10
Sloppy maintenance led to a fatal crash of an American Airlines McDonnell Douglas DC-10 and a subsequent two-month grounding in summer 1979, which had a serious impact on DC-10 sales (586 delivered between 1971 and 2001)
(American Airlines)
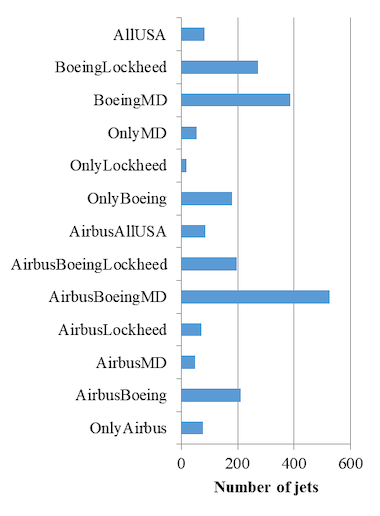
Fig. 7. The different subsamples according to the combination of aircraft models received
(Authors’ own depiction)
4. Descriptive evidence
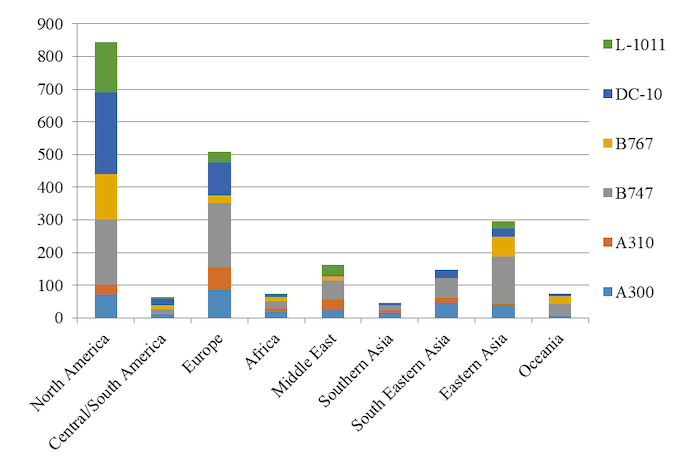
To begin with the descriptive analysis, Figure 8 informs on the effective market size for wide-body jets by nine world regions and Figure 9 provides the percentages of the within-region distribution of the six wide-body models. Unsurprisingly, the majority of jets between 1969 and 1989, namely, 1,649, were acquired by airlines from North America (845), Europe (508), and Eastern Asia (296). As for Airbus, the biggest markets effectively were Europe and North America for the A300 (86 and 73) and, respectively, Europe and the Middle East for the A310 (68 and 31). McDonnell Douglas’s DC-10 and Lockheed’s L-1011 Tristar sold, also unsurprisingly, best in the North-American market, accounting for almost 50 per cent of all deliveries; in other words, the combined Lockheed-McDonnell Douglas-market share in the North-American market was larger than Boeing’s. Boeing, in turn, saw its single-highest regional market share in the Oceanic market with 81 per cent, followed by the Eastern Asian market with 69 per cent. The only regional market in which Airbus managed to grow into the position of the market leader by 1989 was the Southern Asian market (50 per cent) comprising airlines from India, Pakistan, Sri Lanka, Afghanistan, and Bangladesh; the Southern Asian market accounted for only 46 deliveries between 1969 and 1989, though, which makes it the single-smallest market in that period.
Fig. 8. Effective market size for wide-body jets by model and region, 1969-1989
(Authors’ own depiction)
Fig. 9. Regional shares of wide-body jet models, 1969-1989
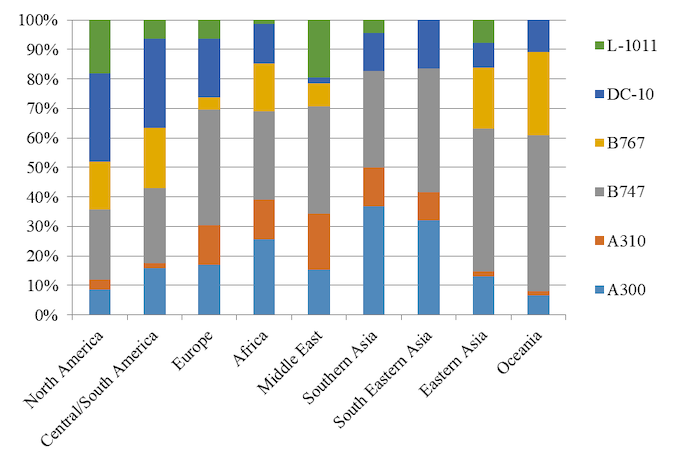
Two sided t-test on equality of mean across groups. Unequal variance in the groups is assumed. Reported are the differences in sample means and the standard errors in parentheses. Significance levels are as follows: * p<0.10, ** p<0.05, *** p<0.01.
(Authors’ own depiction)
Table 5. T-tests on differences in sample means on the aircraft-level, 1974-1989
|
Selected binary variables |
Airbus vs. American manufacturers |
Airbus vs. Boeing |
|
Buyer’s ownership |
||
|
Private ownership |
-0.119*** (0.025) |
-0.092*** (0.027) |
|
Public ownership |
+0.123*** (0.026) |
+0.112*** (0.028) |
|
Mixed ownership |
-0.004 (0.763) |
-0.020 (0.015) |
|
Buyer’s geographical origin |
||
|
Airbus Consortium member country |
+0.092*** (0.020) |
+0.085*** (0.021) |
|
European |
+0.118*** (0.024) |
+0.121*** (0.025) |
|
Central and South American / Caribbean |
-0.018** (0.008) |
-0.015* (0.009) |
|
North American |
-0.149*** (0.023) |
-0.055** (0.024) |
|
African |
+0.031*** (0.012) |
+0.024* (0.013) |
|
Middle Eastern |
+0.039** (0.016) |
+0.030* (0.017) |
|
Southern Asia |
+0.033*** (0.010) |
+0.034*** (0.010) |
|
South Eastern Asia |
+0.063*** (0.016) |
+0.052*** (0.018) |
|
Eastern Asia |
-0.084*** (0.017) |
-0.014*** (0.020) |
|
Oceanic |
-0.033*** (0.008) |
-0.054*** (0.010) |
|
Buyer’s colonial ties |
||
|
to France |
+0.002 (0.006) |
+0.000 (0.006) |
|
to Great Britain |
+0.023 (0.022) |
-0.026 (0.025) |
|
to US |
+0.006 (0.005) |
+0.005 (0.005) |
|
Commonwealth member |
-0.041** (0.020) |
-0.061*** (0.022) |
|
N = 1,810 |
N = 1,294 |
|
(Authors’ own computations)
Table 5 shows the results of a number of statistical t-tests on differences in sample means on the aircraft-level regarding an airline’s ownership status, the broad geographical location of its home country, and the presence of colonial ties of its home country to the manufacturer countries. For the observation period as a whole, we compare the sample of Airbus deliveries with the sample of all American manufacturers’ deliveries, in general, and with Boeing deliveries, in particular. Is the reported difference in sample means statistically significant and positive (negative), this implies that the respective variable’s mean in the Airbus sample is larger (smaller) than the mean in the American manufacturer samples. Since all displayed variables are 0-1-coded dummy variables, this is equal to saying that the proportion of deliveries exhibiting the specific characteristic is significantly higher (lower) in the Airbus sample.
The tests’ implications are as follows: 1) The proportion of deliveries to privately-owned airlines is significantly larger in the American manufacturer samples, while the proportion of deliveries to state-owned airlines is significantly larger in the Airbus sample; there is no statistically significant difference regarding deliveries to airlines with mixed ownership. 2) The proportion of deliveries to Airbus consortium member countries is significantly larger in the Airbus sample. 3) The proportion of deliveries to airlines from Europe, Africa, the Middle East, Southern Asia, and South Eastern Asia35 is generally significantly larger in the Airbus sample, and largest for deliveries to airlines from Europe. Interestingly, the coefficient for deliveries to airlines from Europe as a whole is larger than that for deliveries to Airbus member countries. 4) The proportion of deliveries to airlines from Central and South America and the Caribbean, North America, East Asia, and Oceania is generally significantly larger in the American manufacturer samples; with the exception of Oceania, this distribution is less pronounced in the Boeing subsample. 5) There is no statistically significant difference in sample means when looking at colonial ties to the Airbus member countries France and Great Britain or to the United States. 6) However, the proportion of deliveries to airlines from Commonwealth countries (including but not exhausted by former British colonies) is significantly larger in the American manufacturer samples, and larger in the Boeing subsample compared to all American manufacturers. This probably owes to the fact that the Lockheed Tristar was exclusively equipped with Rolls-Royce turbofan engines manufactured in England. British Airways flew the Tristar as did a couple of airlines based in the Commonwealth.36
Fig. 10. Lockheed L-1011 Tristar
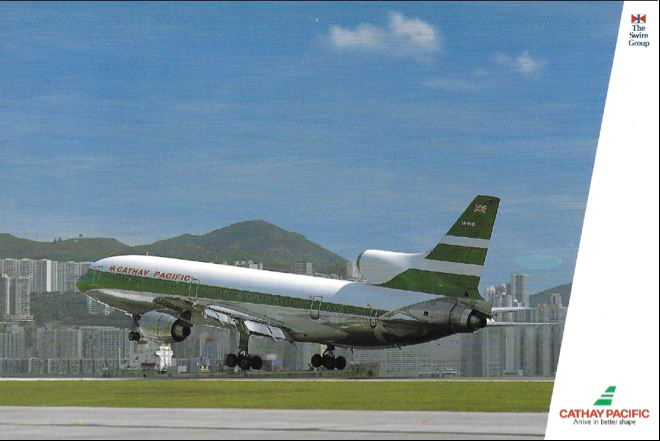
The commercial failure of the Tristar prompted Lockheed to withdraw from passenger aircraft production in 1985 (250 delivered between 1972 and 1985)
(Cathay Pacific Airways)
We perform the same exercise on the airline-level dataset, too. Tables 6 and 7 provide the results. Compared is the subset of airlines that acquired Airbus jets – and possibly American models in addition – with the remaining subset of airlines that did not acquire Airbus jets at all, but exclusively American models (column in the middle of Tables 6 and 7). Additionally, we compare the subset of airlines that exclusively acquired Airbus jets with all remaining airlines – that is, such that did acquire a mix of Airbus and American models and such that focused on American models entirely (column on the far right in Tables 6 and 7). The interpretation of the test output is the same as above.
In all, the results from the t-tests are not as clear as above, when looking at the aircraft-level dataset. The main reason is that switching from aircraft- to airline-level eliminates information on the number of deliveries per airline which works in the above exercise like a sort of frequency weighting; now it is not the frequent, big buyers’ characteristics that inflate the results. The tests’ implications can be summarized as follows: 1) The proportion of deliveries to privately-owned airlines is significantly larger among the airlines that acquired American models exclusively, while the proportion of deliveries to state-owned airlines and such of mixed ownership is significantly larger in the subset of Airbus-acquiring airlines. However, when re-focusing on airlines that exclusively acquired Airbus jets, the significant differences vanish.37 2) The proportion of airlines from Airbus consortium member countries is not significantly larger in the subset of Airbus-acquiring airlines than in the reference group. 3) Among the Airbus-acquiring airlines are significantly more European and South Eastern Asian airlines and significantly less North-American airlines. When turning to the exclusive Airbus customers, only the latter remains significant. 4) There is still no statistically significant difference in sample means when looking at colonial ties to the Airbus member countries France and Great Britain or to the United States; the Commonwealth effect found above also vanishes. 5) Among the airlines that exclusively acquired Airbus jets, we find significantly more airlines that had no long-established customer relationship with Boeing reaching back to 1969, when the B747 appeared, or even farther in the past (i.e., the narrow-body-only era). As evident from Table 7, and matching this finding, airlines that became exclusive Airbus wide-body customer were significantly younger, namely, by 12 years on average. 6) While being a member in either the ATLAS or the KSSU maintenance alliance might have created some path dependency effects with respect to ordering more strongly Boeing or (McDonnell-) Douglas wide-bodies, we do not find evidence that this influenced the decision to buy or not to buy Airbus aircraft.38
Table 6. T-tests on differences in sample means on the airline-level, binary variables only, 1974-1989
|
Selected binary variables |
All airlines acquiring Airbus jets vs. all airlines not acquiring Airbus jets |
All airlines exclusively acquiring Airbus jets vs. all airlines acquiring a mix of Airbus and other jets and all airlines not acquiring Airbus jets |
|
Buyer’s ownership |
||
|
Private ownership |
-0.137* (0.080) |
-0.033 (0.109) |
|
Public ownership |
+0.110* (0.083) |
+0.027 (0.111) |
|
Mixed ownership |
+0.066* (0.043) |
+0.035 (0.047) |
|
Instable ownership |
-0.038* (0.022) |
-0.025* (0.014) |
|
Buyer’s geographical origin |
||
|
Airbus Consortium member country |
+0.047 (0.056) |
+0.043 (0.080) |
|
European |
+0.151** (0.074) |
+0.070 (0.103) |
|
Central and South American / Caribbean |
-0.028 (0.047) |
+0.085 (0.079) |
|
North American |
-0.192*** (0.062) |
-0.185*** (0.055) |
|
African |
-0.034 (0.012) |
+0.027 (0.081) |
|
Middle Eastern |
+0.004 (0.054) |
-0.045 (0.063) |
|
Southern Asia |
+0.006 (0.033) |
-0.002 (0.044) |
|
South Eastern Asia |
+0.104*** (0.038) |
-0.010 (0.045) |
|
Eastern Asia |
-0.002 (0.044) |
+0.005 (0.060) |
|
Oceanic |
-0.009 (0.030) |
+0.055 (0.057) |
|
Buyer’s colonial ties |
||
|
to France |
-0.045 (0.041) |
+0.013 (0.060) |
|
to Great Britain |
+0.001 (0.075) |
+0.045 (0.104) |
|
to US |
+0.015 (0.015) |
-0.008 (0.008) |
|
Commonwealth member |
-0.062 (0.070) |
+0.015 (0.095) |
|
Path dependency in buyer’s customer relations |
||
|
No Boeing customer prior to 1974 |
-0.093 (0.081) |
+0.298*** (0.107) |
|
Membership in ATLAS maintenance alliance |
+0.076** (0.033) |
-0.042** (0.019) |
|
Membership in KSSU maintenance alliance |
+0.033 (0.029) |
-0.034** (0.017) |
|
N = 145 |
N = 145 |
|
Two-sided t-test on equality of mean across groups. Unequal variance in the groups is assumed. Reported are the differences in sample means and the standard errors in parentheses. Significance levels are as follows: * p<0.10, ** p<0.05, *** p<0.01.
(Authors’ own computations)
Table 7. T-tests on differences in sample means on the airline-level, additional continuous variables, 1974-1989
|
Selected continuous variables |
All airlines acquiring Airbus jets vs. all airlines not acquiring Airbus jets |
All airlines exclusively acquiring Airbus jets vs. all airlines acquiring a mix of Airbus and other jets and all airlines not acquiring Airbus jets |
|
Path dependency in buyer’s customer relations |
||
|
Foundation year |
+0.926 (2.935) |
+12.12*** (3.816) |
|
Buyer’s home country’s level of polity |
||
|
Polity |
-1.332 (1.318) |
-1.442 (1.810) |
|
Buyer’s home country’s import dependency |
||
|
Import share of Airbus Consortium member countries |
+3.907* (2.455) |
+0.600 (3.446) |
|
Import share of USA |
-3.658* (2.774) |
-2.808 (3.151) |
|
Buyer’s home country’s net trade position |
||
|
Trade surplus with Airbus Consortium member countries |
-794.1* (437.2) |
-607.0 (588.5) |
|
Trade surplus with USA |
+1,083 (901.3) |
-234.0 (1,129) |
|
Buyer’s home country’s dependency on development aid |
||
|
Aid share of Airbus Consortium member countries |
+0.357 (2.373) |
+0.719 (2.863) |
|
Aid share of USA |
-1.170 (1.779) |
-1.344 (1.374) |
|
N = 126 |
N = 126 |
|
T-test on equality of mean across groups. Unequal variance in the groups assumed. Reported are the differences in sample means and the standard errors in parentheses. Significance levels are as follows: * p<0.10, ** p<0.05, *** p<0.01.
(Authors’ own computations)
Moreover, 6) Airlines do not significantly vary in terms of the polity-level of their home countries. 7) As for import dependency as a crude measure of trading partner taste, the import share of the Airbus Consortium member countries is significantly larger in the subset of Airbus-acquiring airlines, while the import share of the United States is significantly larger in the reference group.39 8) The average trade surplus of an airline’s home country with the Airbus Consortium member countries taken together is significantly larger in the reference group of airlines not having acquired Airbus jets at all.40 9) Finally, there is no significant difference between the subsets as to the aid share of an airline’s home country that is attributable to the Airbus Consortium member countries and the US.
5. Concluding remarks
Our descriptive inquiry into the distribution of the characteristics of the aircraft deliveries and the airlines in our datasets is the first step into investigating the political nature of wide-body aircraft sales in Airbus’s formative period. At the end of this period, Airbus had risen into a serious competitor of Boeing, outperforming Lockheed and McDonnell Douglas alike. The reader familiar with the literature on Airbus’s rise and the evolution of the duopoly with Boeing will not be surprised by part of our findings, for example, on the geographical origin of Airbus customers. The literature has discussed this aspect. However, to the best of our knowledge, we provide the first study that explicitly provides statistical hard facts on the universe of wide-body aircraft delivered between 1969 and 1989.
What are our findings on the political nature of aircraft sales so far? Based on the distribution of aircraft and airline characteristics (including the characteristics of airlines’ home countries), there is suggestive evidence that seems to confirm our alternative hypothesis H1.1 – Airbus (Boeing) sold significantly more (less) likely to state-owned airlines than to privately-owned ones – and H4.1 – the larger the weight of the Airbus consortium member countries (the US) as trading partner(s) of a country, the more likely did an airline of that country buy Airbus (Boeing) aircraft –; and there is evidence that seems to reject H2.1 – Airbus (Boeing) sold significantly more (less) likely to airlines from low-polity countries than to high-polity ones –, H3.1 – airlines from former French and British (US) colonies significantly more likely bought Airbus (Boeing) aircraft –, and H5.1 – the larger the development aid flows from the Airbus consortium member countries (the US) to a receiving country, the more likely did an airline of that country buy Airbus (Boeing) aircraft. It is important to note, however, that our evidence is very tentative, because our descriptive exercise based on mean comparison tests is a form of univariate analysis – that is, only one variable is analysed at a time, under the formal assumption that there is no relationship with the other variables. For example, all US and most North American airlines were privately-owned; it is a priori not clear whether ownership was what mattered or geographical origin. This owes to the fact that the variables for which we reproduce the t-test results in Tables 5 to 7 are, in fact, not independent from each other. Hence the natural next step is to extend our framework to multivariate analysis enabling us to control for specific characteristics when analysing another characteristic. 41
6. Appendix
Table A1. Non-Soviet jet aircraft types entering airline service until 1987
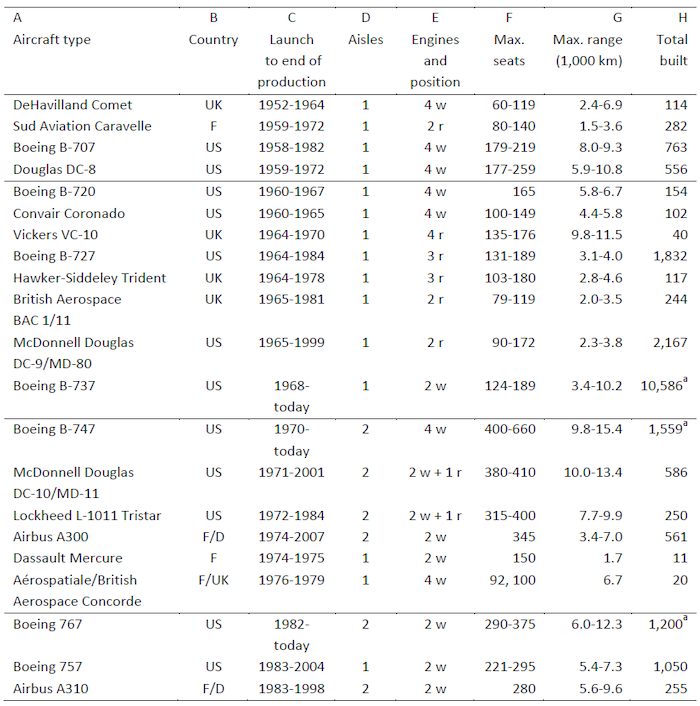
a As of late November 2020.
A – Listed are all Western-built passenger jets used for major routes, thus regional jets are excluded. All civil variants of a specific type and their data are included even if produced after 1989.
B – Country/countries of main producer(s). D: Germany, F: France, UK: United Kingdom, US: United States.
C – Ranked according to first regular passenger flight.
D – Wide-body aircraft have got two aisles by definition.
E – Engines mounted at the rear (r) and/or under the wing (w).
F – Wide-body aircraft are/were typically delivered with a two or three-class configuration and were thus equipped with just two thirds of the seats.
G – The operation range is difficult to specify depending on the capacity utilization. Usually the range at normal capacity is two thirds of the maximum.
H – Without aircraft of military versions.
(All details taken from the German and English Wikipedia articles on the aircraft types)
Table A2. Top Five customers per manufacturer by cumulated deliveries over 1969-1989
|
Airline |
Country |
Cumulated deliveries |
Over |
Share in all deliveries of the respective manufacturer |
|
A) Airbus A300/310 |
||||
|
Air France |
France |
33 |
1974-1989 |
6.8 % |
|
Lufthansa |
Germany |
32 |
1976-1989 |
6.6 % |
|
Eastern Airlines |
USA |
32 |
1977-1983 |
6.6 % |
|
Pan Am |
USA |
28 |
1984-1987 |
5.8 % |
|
American Airlines |
USA |
25 |
1988-1989 |
5.2 % |
|
B) Boeing B747/B767 |
||||
|
Japan Airlines |
Japan |
79 |
1970-1989 |
7.6 % |
|
American Airlines |
USA |
61 |
1970-1988 |
5.9 % |
|
All Nippon Airlines |
Japan |
59 |
1978-1989 |
5.7 % |
|
Pan Am |
USA |
45 |
1969-1979 |
4.3 % |
|
Qantas |
Australia |
45 |
1971-1989 |
4.3 % |
|
C) Lockheed L-1011 Tristar |
||||
|
Delta Airlines |
USA |
43 |
1973-1983 |
17.3 % |
|
Eastern Airlines |
USA |
40 |
1972-1978 |
16.1 % |
|
Trans World Airlines |
USA |
38 |
1972-1982 |
15.3 % |
|
All Nippon Airways |
Japan |
21 |
1973-1978 |
8.4 % |
|
British Airways |
Great Britain |
21 |
1974-1981 |
8.4 % |
|
D) McDonnell Douglas DC-10 |
||||
|
US Air Force |
USA |
60 |
1981-1988 |
13.4 % |
|
United Airlines |
USA |
42 |
1971-1982 |
9.4 % |
|
American Airlines |
USA |
35 |
1971-1980 |
7.8 % |
|
Northwest Airlines |
USA |
22 |
1972-1974 |
4.9 % |
|
Japan Airlines |
Japan |
22 |
1976-1988 |
4.9 % |
(Authors’ dataset)
Table A3. Cumulated aircraft deliveries per first customer over 1974-1989 by type
|
Code |
Airline |
A300 |
A310 |
B747 |
B767 |
L-1011 |
MD-11 |
|
1 |
Aer Lingus |
- |
- |
2 |
- |
- |
- |
|
2 |
Aerocondor |
1 |
- |
- |
- |
- |
- |
|
3 |
Aerolineas Argentinas |
- |
- |
7 |
- |
- |
- |
|
4 |
Aeroméxico |
- |
- |
- |
- |
- |
4 |
|
5 |
Air Afrique |
3 |
- |
1 |
- |
- |
3 |
|
6 |
Air Algerie |
- |
2 |
- |
- |
- |
- |
|
7 |
Air Canada |
- |
- |
7 |
19 |
16 |
- |
|
8 |
Air China |
- |
- |
1 |
2 |
- |
- |
|
9 |
Air France |
24 |
9 |
36 |
- |
- |
- |
|
10 |
Air Gabon |
- |
- |
1 |
- |
- |
- |
|
11 |
Air India |
3 |
6 |
13 |
- |
- |
- |
|
12 |
Air Inter |
6 |
- |
- |
- |
- |
- |
|
13 |
Air Lanka |
- |
- |
- |
- |
2 |
- |
|
14 |
Air Madagascar |
- |
- |
1 |
- |
- |
- |
|
15 |
Air Mauritius |
- |
- |
- |
2 |
- |
- |
|
16 |
Air New Zealand |
- |
- |
6 |
4 |
- |
8 |
|
17 |
Air Niugini |
- |
1 |
- |
- |
- |
- |
|
18 |
Air Seychelles |
- |
- |
1 |
- |
- |
- |
|
19 |
Air Siam |
1 |
- |
- |
- |
- |
1 |
|
20 |
Air Zaire |
- |
- |
- |
- |
- |
2 |
|
21 |
Air Zimbabwe |
- |
- |
1 |
- |
- |
- |
|
22 |
Alitalia |
8 |
- |
17 |
- |
- |
8 |
|
23 |
All Nippon Airways |
- |
- |
20 |
39 |
21 |
- |
|
24 |
American Airlines |
25 |
- |
16 |
45 |
- |
35 |
|
25 |
Ansett |
- |
- |
- |
5 |
- |
- |
|
26 |
Ariana Afghan Airlines |
- |
- |
- |
- |
- |
1 |
|
27 |
Austrian Airlines |
- |
2 |
- |
- |
- |
- |
|
28 |
Avianca |
- |
- |
1 |
- |
- |
- |
|
29 |
Balair |
- |
1 |
- |
- |
- |
1 |
|
30 |
Bavaria Germanair |
1 |
- |
- |
- |
- |
- |
|
31 |
Biman Bangladesh Airlines |
- |
- |
- |
- |
- |
1 |
|
32 |
Braathens |
- |
- |
- |
2 |
- |
- |
|
33 |
Braniff International Airways |
- |
- |
5 |
- |
- |
- |
|
34 |
Britannia Airways |
- |
- |
- |
8 |
- |
- |
|
35 |
British Airtours |
- |
- |
- |
- |
2 |
- |
|
36 |
British Airways |
- |
- |
25 |
- |
21 |
- |
|
37 |
British Caledonian Airways |
- |
2 |
- |
- |
- |
8 |
|
38 |
British Overseas Airways Corporation (BOAC) |
- |
- |
15 |
- |
- |
- |
|
39 |
BWIA International |
- |
- |
- |
- |
4 |
- |
|
40 |
Cameroon Airlines |
- |
- |
1 |
- |
- |
- |
|
41 |
Canadian Airlines International |
- |
- |
- |
8 |
- |
- |
|
42 |
Cathay Pacific |
- |
- |
17 |
- |
2 |
- |
|
43 |
China Airlines |
9 |
- |
10 |
2 |
- |
- |
|
44 |
China Eastern Airlines |
2 |
- |
- |
- |
- |
- |
|
45 |
Citicorp Leasing |
- |
- |
- |
- |
- |
3 |
|
46 |
Civil Aviation Administration of China (CAAC) |
1 |
5 |
7 |
4 |
- |
- |
|
47 |
Condor |
- |
5 |
2 |
- |
- |
3 |
|
48 |
Continental Airlines |
3 |
- |
4 |
- |
- |
18 |
|
49 |
Court Line Aviation |
- |
- |
- |
- |
2 |
- |
|
50 |
CP Air |
- |
- |
4 |
- |
- |
7 |
|
51 |
Cruzeiro |
2 |
- |
- |
- |
- |
- |
|
52 |
Cyprus Airways |
- |
4 |
- |
- |
- |
- |
|
53 |
Delta Airlines |
- |
- |
5 |
30 |
43 |
5 |
|
54 |
Eastern Airlines |
32 |
- |
- |
- |
40 |
- |
|
55 |
Egypt Air |
8 |
- |
2 |
5 |
- |
- |
|
56 |
El Al |
- |
- |
7 |
4 |
- |
- |
|
57 |
Emirates |
1 |
2 |
- |
- |
- |
- |
|
58 |
Ethiopian Airlines |
- |
- |
- |
3 |
- |
- |
|
59 |
Finnair |
- |
- |
- |
- |
- |
3 |
|
60 |
Garuda Indonesia |
9 |
- |
6 |
- |
- |
6 |
|
61 |
Germanair |
2 |
- |
- |
- |
- |
- |
|
62 |
Ghana Airways |
- |
- |
- |
- |
- |
1 |
|
63 |
Gulf Air |
- |
- |
- |
6 |
7 |
- |
|
64 |
Hapag-Lloyd |
2 |
5 |
- |
- |
- |
- |
|
65 |
Iberia |
6 |
- |
9 |
- |
- |
9 |
|
66 |
Indian Airlines |
10 |
- |
- |
- |
- |
- |
|
67 |
Interflug |
- |
3 |
- |
- |
- |
- |
|
68 |
Iran Air |
8 |
- |
7 |
- |
- |
- |
|
69 |
Iraqi Airways |
- |
- |
3 |
- |
- |
- |
|
70 |
Japan Airlines |
- |
- |
65 |
14 |
- |
22 |
|
71 |
Japan Asia Airways |
- |
- |
1 |
- |
- |
- |
|
72 |
Kar-Air |
2 |
- |
- |
- |
- |
- |
|
73 |
Kenya Airways |
- |
3 |
- |
- |
- |
- |
|
74 |
KLM |
- |
10 |
24 |
- |
- |
11 |
|
75 |
Korean Airlines |
17 |
- |
18 |
- |
- |
3 |
|
76 |
Kuwait Airways |
3 |
8 |
4 |
3 |
- |
- |
|
77 |
Laker Airways |
3 |
- |
- |
- |
- |
11 |
|
78 |
LAN Chile |
- |
- |
- |
2 |
- |
- |
|
79 |
La Tur Airlines |
2 |
- |
- |
- |
- |
- |
|
80 |
Lauda Air |
- |
- |
- |
2 |
- |
- |
|
81 |
LOT |
- |
- |
- |
2 |
- |
- |
|
82 |
LTU |
- |
- |
- |
- |
3 |
- |
|
83 |
LTU Süd |
- |
- |
- |
3 |
- |
- |
|
84 |
Lufthansa |
18 |
14 |
35 |
- |
- |
11 |
|
85 |
Malaysian Airline System |
4 |
- |
5 |
- |
- |
3 |
|
86 |
Martinair |
- |
2 |
2 |
1 |
- |
4 |
|
87 |
Mexicana |
- |
- |
- |
- |
- |
5 |
|
88 |
Middle East Airlines |
- |
- |
3 |
- |
- |
- |
|
89 |
National Airlines |
- |
- |
2 |
- |
- |
15 |
|
90 |
Nigeria Airways |
- |
4 |
- |
- |
- |
3 |
|
91 |
Northwest Airlines |
- |
- |
43 |
- |
- |
22 |
|
92 |
Olympic Airways |
8 |
- |
2 |
- |
- |
- |
|
93 |
Overseas National Airways |
- |
- |
- |
- |
- |
5 |
|
94 |
Pacific Southwest Airlines |
- |
- |
- |
- |
5 |
- |
|
95 |
Pacific Western Airlines |
- |
- |
- |
2 |
- |
- |
|
96 |
Pakistan International Airlines |
4 |
- |
2 |
- |
- |
4 |
|
97 |
Pan Am |
12 |
16 |
45 |
0 |
12 |
1 |
|
98 |
Philippine Airlines |
5 |
- |
4 |
- |
- |
2 |
|
99 |
Piedmont Airlines |
- |
- |
- |
6 |
- |
- |
|
100 |
Qantas |
- |
- |
33 |
12 |
- |
- |
|
101 |
Royal Air Maroc |
- |
- |
1 |
- |
- |
- |
|
102 |
Royal Jordanian |
- |
5 |
3 |
- |
8 |
- |
|
103 |
Sabena |
- |
3 |
3 |
- |
- |
5 |
|
104 |
SAS |
4 |
- |
6 |
4 |
- |
5 |
|
105 |
Saudia |
11 |
- |
22 |
- |
16 |
- |
|
106 |
Singapore Airlines |
8 |
11 |
39 |
- |
- |
7 |
|
107 |
Somali Airlines |
- |
1 |
- |
- |
- |
- |
|
108 |
South African Airways |
7 |
- |
15 |
- |
- |
- |
|
109 |
Swissair |
- |
9 |
7 |
- |
- |
13 |
|
110 |
Syrian Arab Airlines |
- |
- |
2 |
- |
- |
- |
|
111 |
TACA International Airlines |
- |
- |
- |
1 |
- |
- |
|
112 |
TAP |
- |
3 |
4 |
- |
5 |
- |
|
113 |
Thai Airways |
20 |
2 |
8 |
- |
- |
5 |
|
114 |
Toa Domestic Airlines |
10 |
- |
- |
- |
- |
- |
|
115 |
Trans Australia Airlines |
5 |
- |
- |
- |
- |
- |
|
116 |
Trans European Airways |
2 |
- |
- |
- |
- |
- |
|
117 |
Trans International Airlines |
- |
- |
- |
- |
- |
3 |
|
118 |
Transamerica Airlines |
- |
- |
3 |
- |
- |
- |
|
119 |
Transbrasil |
- |
- |
- |
3 |
- |
- |
|
120 |
Tunisair |
1 |
- |
- |
- |
- |
- |
|
121 |
Turkish Airlines |
- |
12 |
- |
- |
- |
3 |
|
122 |
TWA |
- |
- |
23 |
10 |
38 |
- |
|
123 |
United Airlines |
- |
- |
23 |
19 |
- |
42 |
|
124 |
UTA |
- |
- |
8 |
- |
- |
6 |
|
125 |
Varig |
2 |
- |
8 |
7 |
- |
10 |
|
126 |
VASP |
3 |
- |
- |
- |
- |
- |
|
127 |
Wardair |
- |
12 |
3 |
- |
- |
2 |
|
128 |
Western Airlines |
- |
- |
- |
- |
- |
13 |
|
129 |
World Airways |
- |
- |
3 |
- |
- |
9 |
|
130 |
YAT Yugoslav Airlines |
- |
- |
- |
- |
- |
2 |
|
131 |
Zambia Airways |
- |
- |
- |
- |
- |
1 |
|
132 |
Cargolux |
- |
- |
2 |
- |
- |
- |
|
133 |
Federal Express |
- |
- |
- |
- |
- |
11 |
|
134 |
Flying Tiger Line |
- |
- |
6 |
- |
- |
- |
|
135 |
Nippon Cargo Airlines |
- |
- |
4 |
- |
- |
- |
|
136 |
Seaboard World Airlines |
- |
- |
4 |
- |
- |
- |
|
137 |
Abu Dhabi Amiri Flight |
2 |
- |
1 |
- |
- |
- |
|
138 |
Algerian Government |
- |
- |
- |
- |
1 |
- |
|
139 |
Brunei Government |
- |
1 |
- |
- |
- |
- |
|
140 |
General Electric |
1 |
- |
- |
- |
- |
- |
|
141 |
Iran Air Force |
- |
- |
4 |
- |
- |
- |
|
142 |
Iraqi Government |
- |
- |
1 |
- |
- |
- |
|
143 |
Jordanian Government |
- |
- |
- |
- |
1 |
- |
|
144 |
Saudi-Arabian Government |
- |
- |
2 |
- |
- |
- |
|
145 |
USAF |
- |
- |
4 |
- |
- |
60 |
Codes 1 to 131 represent passenger airlines (with, possibly, a cargo branch). Codes 132 to 136 represent pure cargo airlines. Codes 137 to 145 represent miscellaneous military and non-military customers.
(Authors’ dataset)